
These are Advanced Social Analytics and are advanced version of the regular available Campaign Analytics. These help you to monitor social media as it happens and track your campaign success. Understand the impact of your efforts so you can optimize your social media marketing.
-
Measure Across Channels - Measure social engagement across social channels to determine the success or your social efforts.
-
Measure Campaign Success - Campaign analytics allow you to view advanced metrics, from traffic and engagement to shares and entries.
-
Gain Demographic Insights -Identify which demographics participate with your brand most. Use these insights for future marketing initiatives.
-
Track Post Engagement - View post engagement by channel for each post you publish via Promotions messenger.
-
Understand Viral Impact - View how many people shared your promotion and on what channels. See how many views each share received.
-
Identify Trends - Measure your success with insights. Find out what resonates with your audience and optimize your social marketing.
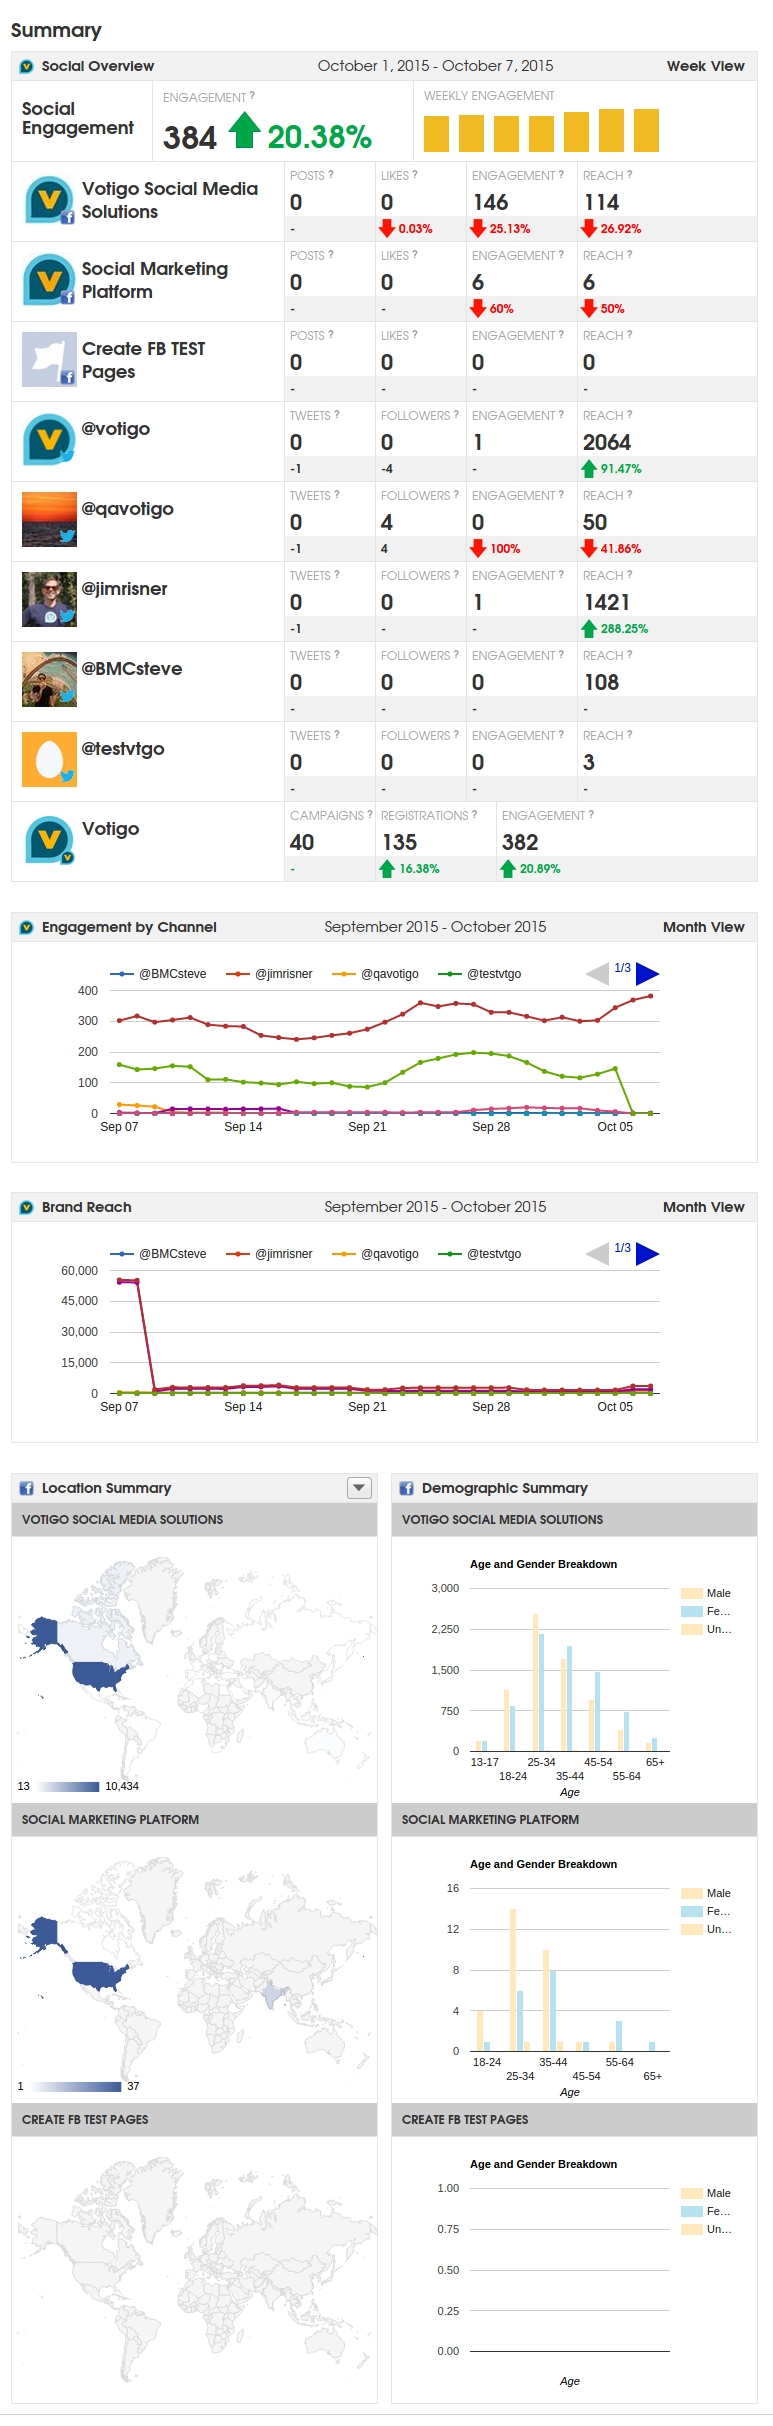
Summary – Gives you a summary of the brand and or location selected.
Social Overview – Gives a Social Engagement score for a week.
Engagement - The number of interactions that people have taken with your Brand from October 1, 2015 to October 7, 2015. Engagement is defined for Facebook as; a post to your wall; likes, comments on or shares a Page post. Engagement is defined for Twitter as; a Retweet; a Mention of your Twitter Profile; a Direct Message to your Twitter Profile. Engagement is defined for Votigo as; a registration to a apps; an entry to a apps; a vote on a apps entry. Also shown is the change from the previous week (if available).
Engagement score for each brand -
-
Facebook Page -
-
Posts - Total number of Posts by the Brand from 2015-10-01 to 2015-10-07. Also shown is the change from the previous week (if available).
-
Likes - Total number of Likes of the Brand Page from 2015-09-29 to 2015-10-05. Also shown is the change from the previous week (if available).
-
Engagement - The number of unique people who have created a story about your Page from 2015-09-29 to 2015-10-05. A story is created when someone likes your Page; posts to your Page Wall; likes, comments on or shares one of your Page posts; answers a question you posted; responds to your event; mentions your Page; tags your Page in a photo; checks in at your Place or recommends your Place. Also shown is the change from the previous week (if available).
-
Reach - The number of unique people who have seen any content associated with your Page from 2015-09-29 to 2015-10-05. This includes Ads and Sponsored Stories that point to your Page. Also shown is the change from the previous week (if available).
-
-
Twitter -
-
Tweets - Total number of tweets by the Twitter Profile from 2015-10-01 to 2015-10-07. Also shown is the change from the previous week (if available).
-
Followers - Total number of Followers of the Twitter Profile from 2015-10-01 to 2015-10-07. Also shown is the change from the previous week (if available).
-
Engagement - The number of people who have Retweeted or Mentioned the Twitter Profile from 2015-10-01 to 2015-10-07. Also shown is the change from the previous week (if available).
-
Reach - The number of people who may have seen any content associated with the Twitter Profile from 2015-10-01 to 2015-10-07. This includes the Followers of anyone that Retweets or Mentions the Twitter Profile and the Followers of the Twitter Profile. Also shown is the change from the previous week (if available).
-
-
Votigo –
-
Campaigns - Total number of active Campaigns by the Brand from 2015-10-01 to 2015-10-07. Also shown is the change from the previous week (if available).
-
Registrations - The number of Registrations for the Brand's Votigo Campaigns from 2015-10-01 to 2015-10-07. Also shown is the change from the previous week (if available).
-
Engagement - The number of Interaction with the Brand's Votigo Campaigns from 2015-10-01 to 2015-10-07. A Interaction include a Registration, an Entry into a Contest or a Vote. Also shown is the change from the previous week (if available).
-
Engagement by Channel – Gives the graphical representation of the engagement score for Facebook and twitter users for a month.
Brand Reach – Gives the graphical representation of the reach score for Facebook and twitter users for a month.
Location Summary – Gives the pictorial representation of the people by area who liked the Facebook page.
Demographic Summary – Gives the bar graph to display the age and gender of the people who liked the Facebook page.
Comments
0 comments
Article is closed for comments.